ECOONE.VN Summary
This study highlights the potential impact of magnetic fields on water quality, which may have implications for plant growth and development. Theoretical estimates of changes in surface tension, pH and some other properties due to water passing through a magnetic field for a certain period of time were experimentally validated in this study. Overall, the results showed changes in the physicochemical properties of water after the application of a magnetic field. Accordingly, pH increased significantly (p < 0.05) from 2 to 2.25, from 4 to 4.5, from 6 to 6.45, from 7.3 to 7.8 and from 8 to 8.7, except at pH 10, which decreased from 10 to 9.7. In addition, the model developed in this study shows that the change in electrical conductivity (EC) decreases from 9 to 6.11 dS m-1 as the amount of current flowing through the magnetic field increases. The decrease in EC can be described as follows: the magnetically treated water contains fine colloidal molecules and electrolyte chemicals that respond to the magnetic field by increasing their precipitation potential, resulting in a decrease in EC. Furthermore, the Hardness values of the circulating water decreased after the application of the magnetic field. This corroborates the decrease in calcium carbonate adhesion and surface tension values as the hydrogen bonding between protons and water molecules increases and the change in the distribution of molecules in the magnetized water. As the internal magnetic field increases and the hydration shell surrounding the constituent ions weakens, the EC decreases. Finally, using an electron microscope, observing water in regular shapes, such as regular hexagonal tree shapes instead of random irregular shapes after applying a magnetic field, confirmed that the magnetic field has a significant impact on the physical properties of water molecules. In short, magnetic behavior can improve water quality, leading to plant growth and development.
ECOONE.VN
1. Introduction
Chemical modification of water is very important in wastewater treatment. Many works have been carried out to implement such changes, consuming less materials and energy, to reduce treatment costs and improve work efficiency. Water that has been passed through a magnetic field before use is called magnetically treated water (MTW). There are many advantages to using such treated water, although there is still debate about its effectiveness. The biological advantages include increased yield, increased crop maturity, improved sugar, vitamin C and total acid content ( Taha et al., 2022 ) and improved fruit set and flowering ( Taha et al., 2020 ). MTW has many industrial applications. According to (Abu-Saied & Taha, 2020), it is used to prevent flattening on the inner walls of pipelines transporting fluids, most notably water. Taha et al. (2019) note that the oil industry has recently been successful in avoiding calcium carbonate flattening in the Auk field, illustrating how magnetic fluid treatment on offshore platforms has significant benefits. In other well-documented cases, field application has also been used to avoid hydrocarbon deposits in pipelines. (See Figure 1)
Download: Download high-resolution image (150KB)
Download: Download full-size image
Figure 1. Chemical analysis to determine sample hardness.
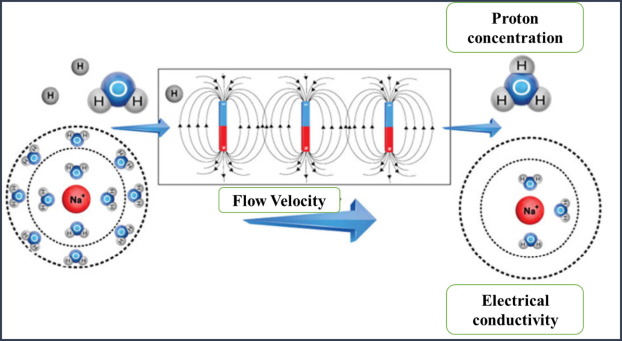
Anti-scale magnetic therapy (AMT) is enhanced by prolonged or repeated magnetic exposure, is more effective when the magnetic field exposure time threshold is exceeded, and is more effective in flow systems, according to several studies (Cho and Lee, 2005, Selim and El-Nady, 2011). Several theories and mechanisms explain how insufficient magnetic fields can influence other fluids and water to reduce scale formation. The main components of ion hydration in water, the fine structure and properties of hydrocarbon bonds are considered (Herzog et al., 1989, Kronenberg, 1985). He develops a model of the proposed pathways for how particularly weak fields can influence the number of hydrogen bonds between water molecules due to triplet-singlet transitions in the electron-proton Zeeman multiplets of the water molecule and its immediate surroundings. Baker and Judd listed additional mechanisms such as intramolecular/intraionic interactions, Lorentz force effects, contaminant dissolution, and interface effects (Deng and Pang, 2007, Pang and Deng, 2008). Increased magnetic field density causes higher salt rejection rates because water molecules are electrically charged and have small dipoles, resulting in low dielectric constants. Exogenous electric and magnetic fields can affect this dipole. It is well known that exposure of water to weak magnetic fields can change its dielectric constant. Changes in the electric dipole moment of water can alter its physical properties. TDS, EC, and pH are among those physical properties. The purpose of this study was to determine the effects of commercial magnetizers on the TDS and pH of different types of water using a magnetizer specifically designed for each type of water. (Pang & Shen, 2013). Cucumber (cucumis sativus L.) is a common crop in the Cucurbitaceae family, which includes 118 genera and 825 species. Cucumbers have a chromosome count of (2n = 2x = 14). Cucumbers were originally native to India but have grown in most regions. According to the United States Department of Agriculture (USDA), a 100-gram serving of fresh cucumber (with peel) has 16 calories. It is 95 percent water and low in cholesterol and sodium, so eating cucumbers during the hot summer months helps keep the body hydrated. Cucumbers provide low levels of essential nutrients; vitamin K at 16 percent; calcium at 2 percent; iron at 2 percent; magnesium at 4 percent; potassium at 3 percent; and zinc at 2 percent of the daily value (Hachicha et al., 2018).
ECOONE.VN
Many studies have shown that with appropriate management practices, these water sources previously classified as unsuitable for irrigation can be used effectively for crop production without causing long-term adverse effects on crops and soils with and without humus to achieve agricultural sustainability ( Rashad et al., 2022 ). These techniques include the use of advanced irrigation technology, the selection of salt-tolerant crops, and salt leaching below the root zone ( Wan et al., 2010 ). Drought and competing water sources have constrained the use of water resources in some locations in the Middle East ( Gleick, 2014 ). It is important to improve irrigation water through appropriate quantitative and qualitative processes. Therefore, one of the potential alternatives to reduce the total amount of water used in the agricultural sector is to apply technologies that increase crop yield per unit volume of water (water use efficiency, WUE).
Research has shown that the use of magnetically treated water improves agricultural yields and water productivity due to chemical and physical changes in irrigation water quality ( Adeniran et al., 2020 , Liu et al., 2019 ). Pang and Deng (2008) examined the mechanism of water magnetism and proposed a proposal based on the molecular structure of water. MW is generated when water passes through the magnetic field of a permanent magnetic device or electromagnetic device installed on the water supply pipe, where all water and salt molecules vibrate internally ( Babu, 2010 ).
Hasaani et al. (2015) studied the interaction of flowing water with magnetic fields, measuring TDS, pH, EC, viscosity, absorption, thermal conductivity and surface tension for regular tap water before and after applying a magnetic field of 6560G generated by properly arranging permanent magnets around the pipe containing the flowing water (Hasaani et al., 2015). They found that the physical properties of the magnetized water were tested using precise measurement techniques. These included a 12% increase in pH and a 33% and 36% decrease in TDS and EC, respectively. Mechanical properties such as viscosity and surface tension also decreased by 23 and 18%, respectively. Even the thermal conductivity decreased by 16%. This study represents a scientific breakthrough by demonstrating the potential effects of magnetic fields on the physicochemical properties of water, such as changes in pH, conductivity, hardness, and the formation of hexagonal structures. The study shows that magnetically treated water can contain colloidal molecules and electrolyte chemicals that improve their ability to precipitate, leading to a decrease in conductivity. These new findings may have important implications for improving water quality and plant growth, thus opening up new avenues for practical applications of magnetic fields.
The aim of this study was to examine the effects of magnetic field treatment on the growth characteristics, yield, and composition of cucumbers. Magnetic field water treatment produces an antiscaling effect by altering several variables, including water composition, magnetic field strength, flow rate, and the time the water is in the magnetic field.
ECOONE.VN
2. Materials and Experiments
2.1 . Materials
Sodium chloride and magnesium sulfate were purchased from United Company, (Egypt), 99% hydrochloric acid from Sigma Aldrich (USA), sulfuric acid and 25% ammonium ion were purchased from United Co., Egypt. Ethylenediaminetetraacetic acid (EDTA), indicator (Erio-chrome Black T & Phenolphthalein) were purchased from United Company, (Egypt).
2.2 . Solution Preparation
In this study, we studied the effect of magnetic field intensity varying with exposure time. Tap water and sodium chloride were used as solutions. The salt solution was prepared by dissolving a certain amount of NaCl in 200 ml of distilled water and tap water and stirring with a magnetic stirrer for different periods of time at room temperature to ensure complete dissolution.
2.3 . Experimental setup
The magnetic source device (Figure S1) was from Delta Water Treatment Company (Japan), with a magnetic strength of 14,500 Gauss and a magnetic field number of 316. The device consists of an inner magnet surrounded by a copper shell and an outer magnet protected by a steel shield from the inside and outside of the one-way holes for water flow.
2.4. Cation exchange capacity (CEC)
Cation exchange capacity (CEC) assesses the ability of the soil to support replaceable cations that neutralize the negative charge of the soil. The cation sites are exchanged with ammonium ions (NH4 + ), and the exchangeable NH4 + ions are leached by protons from hydrochloric acid (Dontsova, 1998, Horneck et al., 1989). This method has undergone several modifications. In this experiment, prepared tap water samples with different TDS from 1000 to 8000 ppm depending on NaCl and MgSO4 salts were used before and after magnetic treatment to pass through 100 g representative soil sample, then NH4OAc was added and the concentrations of exchangeable Ca2+, Mg2+, K+ and Na+ ions were then analyzed before and after magnetic treatment of water by ICP-OES.
2.5 . Physicochemical analysis of water samples
Total dissolved solids, pH, hardness value, surface tension and alkalinity were all measured using the selected measuring device (Figure 1).
ECOONE.VN
The pH was assessed using a high-precision pen-type pH meter with a sensitivity of 0.01 and an accuracy of ± 0.1. EC and TDS were detected using a TDS meter with an accuracy of ± 2% fs (Dunstan, 1994).
The EDTA titration technique was used to determine hardness. These titrations are base and acid dependent, with the indicator colour shifting to the other medium (base or acid). The chelating agent ethylene diamine tetra acetic acid (EDTA) can be used to quantify magnesium and calcium ions. On a cation such as Ca2+, the EDTA molecule can form a six-site compound. Since both Ca2+ and EDTA solutions are colourless, an indicator is required to indicate the completion of the reaction. Eriochrome Black T, which forms a wine-red compound with Mg2+, is the preferred indicator. During most titrations, a small amount of Mg2+ will bind to the indicator. The Mg2+ in the indicator will react with EDTA after all the Ca2+ has interacted with it. The indicator then returns to its acidic state, turning blue, indicating that the process is complete. The reactions that occur during a titration are listed below, with H3 being the general formula for Erio-chrome Black T ( Alkhazan and Saddiq, 2010 , Szcześ et al., 2011 ).
The acid-neutralizing ability of water is measured by alkalinity. Bicarbonates, carbonates, and hydroxides are alkaline chemicals in water that remove H+ ions and reduce the acidity of the water (i.e., increase the pH). Titration is used in total alkalinity analysis. In this test, the titration is to add 0.02 N sulfuric acid (reagent) to the sample, containing a small amount of Phenolphthalein Indicator until the pink color disappears (V1), then add a few drops of mixed indicator in which the color turns blue due to the presence of carbonate in the water sample. Titrate until the solution turns red (V2).
(1)
Surface tension is a physical property of a liquid that arises from the imbalance of attractive intermolecular forces in which the contact surface tends to shrink into the smallest possible area. It is measured using a Rame-heart apparatus, as shown in Figure S2 ( Qu et al., 2004 ).
2.6 . Soil Permeability and Soil Leaching Coefficient
The soil permeability was measured using the ASTM-D2434 constant water column test and the Darcy equation, and it was observed that the soil permeability increased by about 4x10⁻⁵ cm/s after magnetic treatment, which may be due to the increased ion solubility and decreased ionic bonding as mentioned earlier. The percentage of soil leaching was also determined for 100 g of soil with a total dissolved salt content of 2100 ppm using saline water in the range of 1000 to 5000 ppm. It was found that the salt content in the magnetically treated water increased significantly after washing compared to the non-magnetically treated water, implying that the salt content of the soil decreased when using magnetically treated water. For all types of soil flow problems where laminar flow conditions occur, the permeability coefficient is used to calculate the flow rate (Iwasaka and Ueno, 1999, Joshi, 1996). It can be calculated using Darcy's law using the constant head method:
(2)
where t is the time required for flow, K is the permeability coefficient per volume, V. q is the flux (flow density), and Q is the flow rate (V/t). The flux (q) is proportional to the water level difference h.
(3)
By integrating both sides:
(4)
where h1 and h2 represent the water level difference inside and outside the ring support at the starting point (t1) and the ending point (t2), a represents the cross-sectional area of the ring support, and t represents the elapsed time.
2.7 . Vibrating Sample Magnetometer (VSM)
Vibrating sample magnetometer (VSM) systems monitor the magnetic properties of materials as they change with magnetic field, time, and temperature. Modern commercial VSMs have practically automated operations with data acquisition/control and analysis software running on a personal computer, making VSMs accessible to non-specialists.
2.8 . Morphological analysis (SEM) & (TEM)
The morphological and microstructural characteristics of polymeric materials and their films were examined using SEM & TEM, JEOL JSM-6360LA, Japan (Abu-Saied et al., 2017, Moustafa et al., 2021, Moustafa et al., 2022).
2.9 . Field experiment under cucumber plants
The field experiment was conducted at the El-Sabaheya Horticultural Research Station farm (Horticultural Research Institute, Agricultural Research Institute) in Alex., Egypt, during the summers of 2021 and 2022. The experiment was conducted on an inbred cucumber line (1–26-27–19 KAHA), provided by the Vegetable Production Improvement Project and Major Hybrids, Vegetable Branch, Horticultural Research Institute. Commercial cucumber production according to recommendations was carried out. Five concentrations of irrigation water salts were used with total dissolved salts of 500 (tap water as control), 1000, 1500, 2000, 2500 and 3000 mg/L. Brine was prepared by mixing the electrical conductivity (EC) of tap water (0.78 dS/m) with seawater to obtain 1.57, 2.35, 3.13, 3.91, and 4.69 dS/m at specific ratios of 500, 1000, 1500, 2000, 2500, and 3000 mg/L, respectively. The experiment was designed as a split-plot design with three replications. The combination of two factors formed the treatments. Five salinity levels of brine irrigation water (500, 1500, 2000, 2500, and 3000 mg/L) were assigned in the main plots, and two water treatments (MTW and NMTW) were randomly assigned in the subplots. Irrigation treatments began during early vegetative growth 30 days after transplanting, maintaining soil moisture close to field capacity (28%). Seeds were sown in 209-cell trays on 16 April and 20 March 2021 and 2022. Seedlings were transplanted into the field 21 days after sowing when the second true leaf was fully developed, after which seedlings were thinned to one plant/stump, three plants/m2. Irrigation, fertilization, weeding, and pest control were performed according to the recommendations of the Ministry of Agriculture and Land Reclamation (MALR). The experiments included 270 plastic pots with upper and lower diameters of 28 cm and heights of 30 cm, respectively. The pots were arranged in three rows of nine pots each. Each row represented a specific treatment with three replicates. The first treatment (T1) was the control 500 mg/L, irrigated with tap water and (T2) was tap water treated with magnetic field. The treatments (T3) and (T4) were the 1000 mg/L treatment without magnetic treatment and magnetic treatment; (T5) and (T6) were 1500 mg/L without magnetic treatment and with magnetic treatment. (T7) and (T8) were 2000 mg/L, without magnetic treatment and with magnetic treatment. (T9) and (T10) were 2500 mg/L, without magnetic treatment and with magnetic treatment. At the concentration of 3000 mg/l, cucumber plants could not tolerate this high salinity concentration of water, and it caused dwarfism, poor growth, and vegetative system burn, and then death. Measurements were recorded for vegetative growth traits including: days to first female flower (days), days to first male flower (days), days to first fruit harvest (days), plant length (cm), number of nodes/plant, number of female flowers per node. For yield and yield components, total fruit yield/plant (kg), number of fruits/plant and average fruit weight/plant (gm).
2.10 . Statistical analysis
Analysis of variance (ANOVA) was used to compare the mean values at a significance level of 0.05, followed by Duncan multiple comparison test to determine the differences between treatments and classify the treatments according to their performance. The costate software program was used to conduct this statistical test after checking for normality and homogeneity of variance among treatments.
3. Results and discussion
3.1 . pH, TDS and EC
The pH, EC and TDS values of the water before and after magnetic treatment are shown in Figure 2. Magnetic treatment of the solutions tended to increase the pH except for alkaline water, and also decreased the EC of all solutions. However, after 24 h, this change was neutralized and the solutions returned to their initial values ( Cai et al., 2009 ). The decrease in EC, TDS and increase in pH in the magnetically treated solutions may be the result of changes in hydrogen bonding and improved ion mobility ( Table 1 , Table 2 ). The decrease in EC can be described as follows: magnetically treated water contains fine colloidal molecules and electrolyte chemicals that react with magnetic treatment by increasing their sedimentation, resulting in a decrease in EC ( Pang et al., 2012 ). ECOONE.VN
number of times
run TDS 1
(ppt) TDS 2
(ppt) TDS 3
(ppt) TDS 4
(ppt) TDS 5
(ppt) TDS 6
(ppt) TDS 7
(ppt) TDS 8
(ppt)
1 2 3 4 5 6 7 8
1 0.99 ± 0.08 1.99 ± 0.1 2.98 ± 0.12 3.98 ± 0.15 5.98 ± 0.20 5.96 ± 0.25 6.98 ± 0.35 7.94 ± 0.5
2 0.99 ± 0.05 1.99 ± 0.09 2.98 ± 0.14 3.98 ± 0.17 5.98 ± 0.22 5.96 ± 0.30 6.98 ± 0.33 7.94 ± 0.51
3 0.98 ± 0.06 1.98 ± 0.07 2.96 ± 0.13 3.95 ± 0.15 5.96 ± 0.24 5.95 ± 0.33 6.97 ± 0.37 7.92 ± 0.53
5 0.98 ± 0.08 1.98 ± 0.1 2.96 ± 0.15 3.94 ± 0.19 5.95 ± 0.22 5.95 ± 0.32 6.95 ± 0.33 7.92 ± 0.57
Table 2. Effect of magnetic field on EC of water.
number of times
run EC 1
(ms) EC 2
(ms) EC 2
(ms) EC 3
(ms) EC 4
(ms) EC 6
(ms) EC 7
(ms) EC 8
(ms)
2 4 6 8 10 12 14 16
1 1.98 ± 0.10 3.98 ± 0.24 5.96 ± 0.31 7.96 ± 0.34 9.96 ± 0.42 11.92 ± 0.62 13.94 ± 0.80 15.94 ± 0.88
2 1.98 ± 0.11 3.98 ± 0.25 5.96 ± 0.32 7.96 ± 0.38 9.96 ± 0.50 11.92 ± 0.60 13.94 ± 0.84 15.88 ± 0.84
3 1.97 ± 0.14 3.96 ± 0.22 5.92 ± 0.34 7.9 ± 0.32 9.92 ± 0.45 11.9 ± 0.64 13.92 ± 0.87 15.8 ± 0.88
5 1.97 ± 0.11 3.96 ± 0.28 5.92 ± 0.37 6.88 ± 0.33 9.9 ± 0.50 11.9 ± 0.61 13.9 ± 0.88 15.8 ± 0.9
3.2 . Hardness measurements
Table S1 presents the hardness measurements of the circulating water compared to the circulation numbers, with a clearly defined baseline data of 168 ppm before circulation. After five cycles of circulation, it can be inferred that the water hardness decreased. This confirms the finding of reduced adhesion of calcium carbonate to the surface due to MWT. Magnetic water hardness has become of considerable relevance in agriculture, especially in areas where water quality concerns and lack of access to high-quality water are common. In response to these challenges, modern agricultural practices are increasingly focused on developing efficient and environmentally friendly production methods that can boost crop yields while minimizing environmental impacts. To achieve this goal, researchers have explored the potential of magnetic water treatment to improve soil and water quality, enhance nutrient uptake by plants, and increase agricultural productivity in general. According to (Pang & Jalbout, 2004), this approach holds great promise as a sustainable solution to the pressing challenges facing the agricultural sector.
3.3 . Alkalinity
In fact, alkalinity is defined as the sum of CO 3 -2 , HCO 3 , and OH ions. Because pH fluctuations affect alkalinity. As seen in (Figure S3), the alkalinity of water decreases with each inflow compared to the inflow. Therefore, it is clear that the difference in OH ion concentration leads to discrepancies when comparing measured hardness and alkalinity (Ali, Samaneh, Zohre, & Mostafa, 2014). ECOONE.VN
3.4 . Surface tension
The surface tension value decreases, as shown in Figure 3 , due to the attractive force between water molecules caused by the change in the distribution of molecules due to the applied magnetic field and the increased polarization effect in magnetized water, thus decreasing the surface tension value of water molecules ( Pohlmeier et al., 2010 ).
3.5 . Soil permeability coefficient
Soil permeability Figure 4 is important for predicting optimal nutrient utilization and leaching of excess salts and toxic elements; it was found that soil permeability increased by about 4x10⁻⁵ cm/s after magnetic treatment, which may be due to greater ion solubility and reduced ionic binding, as mentioned previously ( Mohamed & Ebead, 2013 ).
3.6 . Cation exchange capacity. ECOONE.VN
According to Table 3, the leaching of soil with magnetically treated salt water is accompanied by a decrease in soil CEC compared to the untreated equivalent soil. This may be due to the disintegration of water clusters which increases the solubility of salts and also the effect of Lorentz forces which increases ion mobility and reduces ionic binding. The decrease in soil CEC is noticeable for TDS of 1000 and 8000 ppm. The decrease in soil CEC leads to a decrease in salt accumulation and promotes uniform soil infiltration. On the other hand, soil texture is affected by the ratio of Ca2+ and Mg2+ ions, which determines soil compactness. An increase in Ca ions leads to a looser soil structure, while an increase in Mg ions leads to a denser soil. Therefore, soils with high calcium content tend to be more oxidized, better drained and have greater potential for aerobic decomposition of organic matter. Conversely, soils with high magnesium content will have less oxygen, slow drainage and poor decomposition of organic matter. In agriculture, soils should not be too loose or too compacted, but should have a lower Mg ion content than Ca ion to support soil aeration, so using magnetically treated water is useful to remove excess Mg ions without negatively affecting water holding capacity.
Table 3. CEC and concentrations of Na + , K + , Ca + 2 and Mg + 2 ions.
TDS
(ppm ) CEC (meq/100 g)
Blank Na K Ca Mg
1000 NMT 15.21 ± 0.80 0.74 ± 0.08 3.84 ± 0.01 7.45 ± 0.06
MT 8.16 ± 0.50 0.62 ± 0.07 0.34 ± 0.03 3.35 ± 0.04
2000 NMT 17.92 ± 0.17 0.82 ± 0.05 4.12 ± 0.08 11.19 ± 0.14
MT 16.09 ± 0.12 0.63 ± 0.08 0.46 ± 0.08 11.02 ± 0.10
3000 NMT 26.02 ± 0.51 0.84 ± 0.04 4.85 ± 0.05 27.58 ± 0.14
MT 23.77 ± 0.74 0.73 ± 0.07 0.39 ± 0.04 26.58 ± 0.17
4000 NMT 42.12 ± 0.97 1.32 ± 0.02 5.14 ± 0.09 31.47 ± 0.20
MT 40.58 ± 0.90 1.11 ± 0.03 0.60 ± 0.07 31.29 ± 0.22
5000 NMT 61.97 ± 1.1 1.37 ± 0.04 6.02 ± 0.02 32.33 ± 0.12
MT 57.39 ± 1.1 1.14 ± 0.02 0.69 ± 0.04 31.84 ± 0.13
6000 NMT 71.25 ± 1.25 1.51 ± 0.05 6.15 ± 0.04 33.30 ± 0.17
MT 58.48 ± 1.5 1.17 ± 0.07 1.58 ± 0.03 29.77 ± 0.18
7000 NMT 98.03 ± 1.1 1.60 ± 0.06 6.26 ± 0.07 41.77 ± 0.12
MT 86.24 ± 1.2 1.17 ± 0.05 2.18 ± 0.01 38.15 ± 0.20
8000 NMT 101.56 ± 1.33 1.67 ± 0.07 6.61 ± 0.04 44.09 ± 0.24
MT 80.49 ± 1.24 1.19 ± 0.06 3.07 ± 0.04 36.49 ± 0.30
3.7 . Vibrating sample magnetometer (VSM)
Magnetized water exhibits magnetic properties, as seen in Figure S4. Its lower magnetic properties are due to the small amount of protons and water molecules involved in this conductivity in closed hydrogen bonded chains, which only account for a small fraction of protons and water molecules in water. This provides further evidence for the existence of closed hydrogen bonded chains.
3.8 . Scanning electron microscopy (SEM) & transmission electron microscopy (TEM)
Under electron microscopy, it can be clearly seen from Figure 5a, Figure 5b that water grows in an irregular random pattern among the salt deposits before magnetic treatment. After treatment, regular water forms appear in the salt deposits, such as regular hexagonal ice crystals, indicating that the hexagonal tree shape produces more well-formed crystals. Confirming the influence of magnetic field on the rearrangement and arrangement of water crystals, as well as improving the quality of water used in medical treatment (Abdel Tawab et al., 2011, Ghauri and Ansari, 2006, Lewis and Sjöstrom, 2010). One of the most common properties of water is the buoyancy of ice in it. When other substances change from a liquid state to a solid state, the density of the molecules and atoms that make up the solid increases and the substance becomes relatively heavier. ECOONE.VN
On the other hand, the water particles are arranged in a very controlled manner, with some large spaces between them. As the ice melts and becomes water again, the particles become more active. As the particles become more active, the spaces between them close, creating a liquid form of water that is heavier and denser than the solid form. The TEM image illustrates that the water crystals formed from distilled water were distorted and incomplete before the magnetic treatment, but the water formed complete crystals. So the SEM and TEM indicate that the magnetic treatment was stronger and had a more significant effect. The magnetic field tends to be the more active energy. When a geometrically complete crystal is formed, we can assume that the water is in harmony with nature and the water particles merge to form a crystal nucleus. When the nucleus develops into a stable hexagonal shape, a visible water crystal is formed, so magnetic therapy can increase the quality and quantity of water intake, feed value, rumen fermentation, blood profile and antioxidant status, and thus milk and labneh production. ECOONE.VN
3.9 . Effect of magnetic water on growth and yield of cucumber plants
This experiment was conducted to evaluate the effects of magnetic treatment of saline irrigation water and fresh irrigation water on the growth and yield of cucumber plants. Table 4 of the analysis of variance values showed that there were no significant differences in the blocks except for the mean fruit weight of the trait; this may be due to the difference in soil fertility between the cultivation sites of different replicate varieties, leading to differences in yield between varieties.
Table 4. Analysis of variance combining growth and yield characteristics and components of cucumber (in 2021 and 2022).
SOV DF Number of days to first
female
flower
blooming
(days) Number of days to first
male
flower
blooming (days)
Number of days to first
harvest
(days) Plant length
(cm.) Number
of
nodes/plant Number
of
females
under/node Total
yield
/Plant
(kg) Number
of
fruits/plant Average
fruit
weight (grams)
Block 2 1.3 0.200 2.043 58.825 1.201 0.108 0.002 8.397 141.997**
Total 4 14.148** 21.906** 4.805* 3738.47** 76.159** 3.901** 6.788** 597.589** 514.949**
Treatment 1 6.302** 25.025** 1.008 1340.001** 27.075** 0.427 1.860** 173.136** 139.363*
c × t 4 5.598** 4.411 2.680* 57.648 1.124 0.0327 0.147 2.926 247.767**
Error 10 0.583 1.815 0.533 19.183 0.403 0.089 0.091 8.619 23.883
*, ** Significant and highly significant at the 0.05 and 0.091 levels, respectively 0.01.
In addition, analysis of variance values showed that there were significant differences in all studied traits at each saline concentration and magnetic treatment, which indicated that cucumber plants were affected on their growth and yield by different saline concentrations as well as the use of magnetic water treatment. On the other hand, the obtained data showed insignificant differences in the interaction values between saline concentration and magnetic treatment, except for the traits of days to first female flowering, days to first fruit harvest, and average fruit weight (grams).
Table S2 In this section, we are interested in studying the characteristics of cucumber plant growth traits, their effects on different levels of saline irrigation water and magnetic water treatment, and the interaction between these two factors. The results of the growth characteristics illustrated significant differences in all the studied characteristics except days to first fruit harvest when we used magnetic water treatment and non-magnetic treatment, where the magnetic treatment recorded the highest values. The highest values of the magnetic treatment for saline and freshwater irrigation water were due to the high solubility of the magnetically treated water compared to the non-magnetically treated water in terms of decomposition and spreading. Regarding the trait days to first male and female flower, the data obtained indicated significant differences between irrigation water with salinity of 500 mg/L and irrigation water with salinity of 500, 2000 and 2500 mg/L. The highest reduction value (days) was in irrigation water with salinity of 2500 mg; this was due to the accumulation of salt around the plant root system and thus, salt stress occurred, promoting early flowering. For days to first fruit harvest, the data did not show significant differences between irrigation water salt concentrations except for the concentration of 1500 mg/L.
Regarding the plant height trait, the data obtained showed that there was no significant difference between the water salinities of 500 mg/L and 1000 mg/L, while there was a significant difference with other irrigation water salinities, in which the plant height decreased by 19.6% and 28% at 2000 and 2500 mg/L, respectively, indicating that as the irrigation water salinity increased, the growth of cucumber plants also decreased. For the number of nodules/plant, the results obtained showed that there was no significant difference between the two water salinities of 500 mg/L and 1000 mg/L. On the other hand, there was a significant difference among the irrigation water salinities, in which the irrigation water salinity of 2500 mg/L recorded the lowest value. Zhao et al. (2021) found that magnetic or ionized irrigation water was beneficial for soil water uptake by plants, which was reflected in the growth of winter wheat, leading to improved growth indices. According to Maheshwari and Grewal (2009), the physical and chemical properties of water were completely changed after magnetic treatment, making the water more useful to the plant system, resulting in better cell activity and plant growth (Maheshwari & Grewal, 2009). All these changes lead to changes in plant growth parameters, such as changes in height and mass, as well as increased water uptake by plants, which increases nutrient uptake due to the small water molecules of magnetized water, resulting in increased agricultural productivity ( Maheshwari and Grewal, 2009 , Abdelraouf et al., 2020 , Zhao et al., 2021 , Rashad et al., 2021 ). In terms of total yield/plant (kg), there was a significant difference among all irrigation water salinity concentrations, the data showed that the yield value decreased by 12% when water salinity increased from 1000 mg/L to 1500 mg/L and decreased by 34.5% when water salinity increased from 1500 to 2000 mg/L and decreased by 48% when water salinity increased from 2000 mg/L to 2500 mg/L, while the yield value decreased by 74% when water salinity increased from 500 mg/L to 2500 mg/L. Shahin et al (2016) also found similar results on cucumber, demonstrating that magnetic seeds were germinated and immersed in magnetized water (40.0 mT) to evaluate and analyze the growth characteristics, yield, and contents of some nutrients (N, P, K, Fe, Mn, Zn, and Cu) of cucumber plants ( Khatab et al., 2016 , Shahin et al., 2016 ; Hafez et al., 2019 , Hafez et al., 2020a ). The results showed that magnetic treatment increased cucumber plant height, yield (kg/m 2 ), fruit length, fruit diameter, and % leaf dry matter when compared to the control treatment. Anmar et al, 2022 found that magnetic treatment of seeds for 2 min before planting and irrigation with magnetically treated water had a positive effect on all growth and yield parameters of broad bean. For the trait number of pods/plant, the results obtained showed the effect of increasing the amount of salt irrigation water on the number of pods/plant, in which there was a significant difference between the concentrations of 1500, 2000 and 2500 mg/L, the lowest value was recorded at the concentrations of 2000 and 2500 mg/L. For the trait average pod weight (gm), the data recorded showed a significant difference between the concentration of 500 mg/L and other concentrations. However, no significant difference appeared between the concentrations of 1000 mg/L and 1500 mg/L with a significant difference between the concentrations of 2000 mg/L and 2500 mg/L. At the same time, the lowest value for average fruit weight was recorded in the saline irrigation water of 2500 mg/L. As shown in Table 4, the interaction between water salinity concentration × magnetic treatment and non-magnetic treatment on vegetative growth characteristics, as well as yield and its components. For the trait days to first female flower, the data obtained showed that the highest values were recorded at 500 mg/L water salinity without magnetic water treatment, with no significant difference between them and the salinity concentration of 1000 mg/L irrigation water with magnetic water treatment, the concentration of 2500 mg/L was the lowest value, with no significant difference between it and the concentrations of 2000 mg/L without magnetic water treatment and 2000 and 2500 mg/L with magnetic water treatment. ECOONE.VN
For the trait number of days to first male flower, the results showed that the highest value was recorded in the salt water irrigation treatment at 2500 mg/L without any significant difference between this treatment and the concentration of 2500 mg/L with magnetic treatment, while the recorded value was lower at the concentration of 2000 mg/L without magnetic treatment.
The data on days to first harvest showed that the highest values were observed at a water salinity concentration of 500 mg/L. However, there was no significant difference between this concentration and the concentration at 2500 mg/L. In contrast, all other concentrations, with or without magnetic water treatment, showed significant differences from each other. Regarding plant height, the most favorable results were obtained at salinity levels of 500 and 1000 mg/L when using magnetic water treatment. In contrast, the lowest values were observed at a salinity level of 2500 mg/L without magnetic water treatment, emphasizing the role of magnetic treatment in promoting plant growth. The data on the number of nodules per plant showed that the best treatment was using magnetic water treatment at water salinities of 500 mg/L and 1000 mg/L, while the lowest values were recorded at water salinity of 2500 mg/L without magnetic water treatment, and there was no significant difference between water salinity at 1000 mg/L without magnetic water treatment and 1500 mg/L with magnetic water treatment and also water salinity at 500 mg/L. Regarding the number of female flower traits per node on the plant, the highest value was recorded at a water salinity of 500 mg/L with magnetic water treatment without significant differences for each water salinity concentration of 500 mg/L without magnetic water treatment, 1000 mg/L without magnetic water treatment, 1000 mg/L with magnetic water treatment and 1500 mg/L with magnetic water treatment, while a water salinity of 2500 mg/L without magnetic water treatment recorded the lowest values without significant differences for the same concentration using magnetic water treatment. The results obtained in Table 4 show that the highest overall yield per plant (kg) was recorded at water salinity of 500 mg/L using magnetic water treatment, with no significant difference between it and water salinity at 500 mg/L without magnetic water treatment, and water salinity at 1000 mg/L using magnetic water treatment, whereas water salinity at 1500 mg/L with magnetic treatment was recorded at 2.77 (kg) with no significant difference between it and water salinity at 1500 mg/L without magnetic water treatment and 1000 mg/L using magnetic water treatment, whereas water salinity at 2000 mg/L with magnetic treatment was recorded at 2.06 (kg) with no difference between it and water salinity at 2000 mg/L without magnetic water treatment, vice versa. The lowest value was obtained at a water salinity of 2500 mg/L without magnetic water treatment. It was also found that there was no significant difference between the water salinity at 2000 mg/L without magnetic water treatment and the water salinity at 2500 mg/L with magnetic water treatment. For the number of fruits per plant trait, the results obtained in Table 2 show that the salinity of irrigation water at 500 mg/L using magnetic water treatment recorded the highest value, with no significant difference between it and the salinity of irrigation water at 500 mg/L without magnetic water treatment and the salinity of water at 1000 mg/L using magnetic water treatment and the salinity of water at 1500 mg/L using magnetic water treatment, while the lowest value was recorded at the concentration according to irrigation water at 2500 mg/L without magnetic water treatment. For the trait, mean fruit weight (gm), the highest value was recorded at irrigation water salinity of 1000 mg/L with magnetic water treatment and there was no significant difference between irrigation water salinity of 500 mg/L with and without magnetic water treatment, while the lowest value was obtained at irrigation water salinity of 2500 mg/L without magnetic water treatment. Magnetic irrigation water treatment saves water, increases yield, accelerates crop maturity, improves crop quality, reduces plant diseases, increases fertilizer use efficiency and reduces farm management costs ( Hozayn and Qados, 2010 ; Selim, 2008 ; Amiri and Dadkhah, 2006 ). Magnetic water treatment changes the structure of water, increases mineral solubility, reduces surface tension and provides nutrients necessary for plant growth ( Altalib et al., 2022 , Babu, 2010 , El Sayed, 2014 , Suchitra and Babu, 2011 ). ECOONE.VN
4. Conclusion
Based on this study, magnetic water treatment affects the properties of water molecules. The pH increases from 2 to 2.25, from 4 to 4.5, from 6 to 6.45, from 7.3 to 7.8, and from 8 to 8.7, except for pH10 which decreases from 10 to 9.7. In addition, the change in EC decreases from (9 to 6.11) ms and the recirculation of water through the magnetic water treatment unit causes a slight decrease in TDS and hardness. And the surface tension decreases with MF treatment, which increases the activation energy while decreasing the intramolecular energy. As a result, the size of water clusters increases and more hydrogen bonds are formed. Finally, the morphological characteristics of water molecules are changed by using electron microscopy (TEM and SEM). In conclusion, magnetic treatment can improve water efficiency and consumption,
Author contribution statement CRediT
MA Abu-Saied: Conceptualization, Methodology, Validation, Formal analysis, Data curation, Writing – original draft, Writing – review & editing, Supervision. Eman A. El Desouky: Conceptualization, Methodology, Validation, Formal analysis, Writing – original draft, Writing – review & editing. Mohamed Hafez: Writing – original draft, Writing – review & editing. Mohamed Rashad: Software, Investigation, Data curation, Supervision. ECOONE.VN
Declaration of competing interests
The authors declare that they have no competing financial interests or personal relationships that could have influenced the work presented in this paper.
Acknowledgements
We would like to thank the “Delta Water” industry for providing the equipment dedicated to the experiment. We would like to express our sincere thanks to Mr. Ahmed Ibrahim and Mr. Sherif Ibrahim for providing the equipment to carry out the experiment.
ECOONE.VN
Address
Office: Landmark 81 Building Vinhomes Central Park
720A Dien Bien Phu Street, Ward 22, Binh Thanh District, Ho Chi Minh City
Assembly Workshop
ECO G9 SCIENCE COOPERATIVE
Phuoc Dong Commune, Go Dau District, Tay Ninh Province
Phone 0935 193 151 E-mail : antoanvn1@gmail.com


 0935 193 151
 cdlkhanh@gmail.com